Tide Tables: Difference between revisions
mNo edit summary |
mNo edit summary |
||
| (One intermediate revision by the same user not shown) | |||
| Line 1: | Line 1: | ||
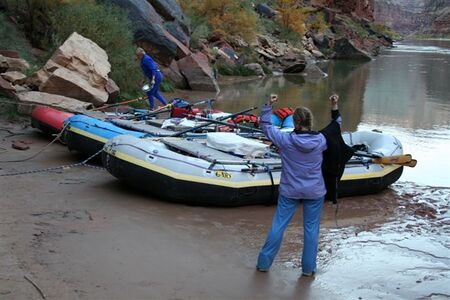
[[Image:Stuck_boats_at_Hot_Na_Na.jpg|450px|right]]Changes in the volume of water being released through Glen Canyon Dam creates rises and falls of the river surface, called tides. Much discussion and thought goes into trying to figure out the Grand Canyon tides. | [[Image:Stuck_boats_at_Hot_Na_Na.jpg|450px|right]]Changes in the volume of water being released through Glen Canyon Dam creates rises and falls of the river surface, called tides. Much discussion and thought goes into trying to figure out the Grand Canyon tides. | ||
Phil Gormley has put a lot of research into the tides in the Grand Canyon. His research is in a PDF document [[:File: | Phil Gormley has put a lot of research into the tides in the Grand Canyon. His research is in a PDF document [[:File:Colorado River Tides 22-03-23 by Gormley.pdf|'''here''']]. Here's the tide table Phil put together: | ||
{| class="wikitable" | {| class="wikitable" | ||
| Line 83: | Line 83: | ||
[[Image:River Tide Chart.jpg|500px|left]] | [[Image:River Tide Chart.jpg|500px|left]] | ||
Click [[The Dam | '''here''']] to return to '''The Dam''' page. | |||
Click [[The Place | '''here''']] to return to '''The Place''' page. | |||
Latest revision as of 09:12, 30 December 2022
Changes in the volume of water being released through Glen Canyon Dam creates rises and falls of the river surface, called tides. Much discussion and thought goes into trying to figure out the Grand Canyon tides.
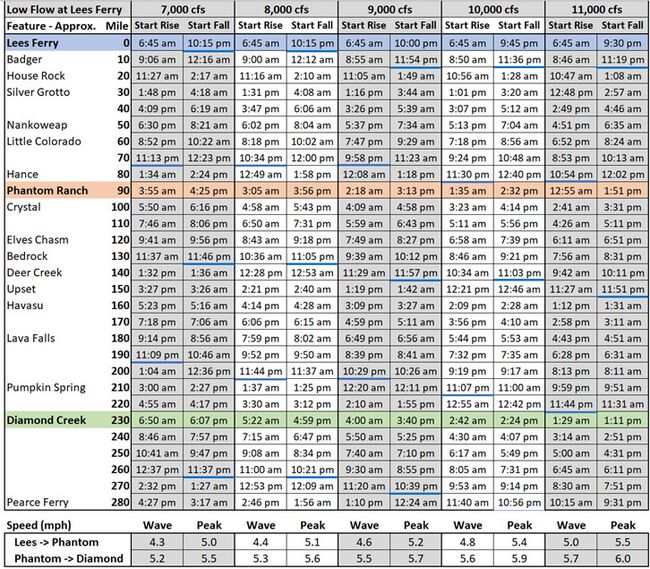
Phil Gormley has put a lot of research into the tides in the Grand Canyon. His research is in a PDF document here. Here's the tide table Phil put together:
| Start with your best estimate for your trip of low flow at Lees Ferry and use that to select the pair of columns to employ below. You will likely reference just one pair of columns for your entire trip. Then use your river mile to estimate when the tide will start to rise and fall. At Lees Ferry, the tide starts to rise within one hour of the estimate 87% of the time. And 86% of the time, it starts to fall within an hour and a half of the prediction. Accuracy diminishes a bit as you travel downriver but is still fairly good. Keep in mind there is often no discharge wave from the dam on summer weekends. Tide estimates are based on “river mile”—second column. River feature locations are approximate.
Note that I used "start rise" and "start fall" rather than "trough" and "peak." This is because the flow tends to stay near its peak level for a few hours so the time of the actual peak is not very useful. The river stays near its trough for a shorter but significant time. "Start rise" and "start fall" are the times at which the flow begins a rapid change that will last for a few hours. Assume the river will be near its low point for a couple hours preceding "start rise" and will be near its highest level for many hours preceding "start fall." |
For any pair of columns above the speed of the discharge wave (most relevant) is represented by the value on the left. The speed of peak flow is represented by the value on the right.
Additional Tide Tables
The following are Tide Tables created by Jay Meierdierck, showing various river locations and the Tide* at that location depending on water flow. The water in the Colorado River in Grand Canyon National Park is released from Glen Canyon Dam. The Dam lets out more water in the day and less at night, making electricity to sell during the day when prices on the market are just a sliver higher than they are at night.
The water traveling through the Canyon does so at different speeds, depending on the amount of water released from the Dam. At flows of 15,000 CFS or less, the 4.0 mph rate should be used. At flows from 15,000 to 20,000 CFS, the 4.5 mph table should be used.
The tables here are based on the following assumptions:
- Glen Canyon Dam normal operations have higher releases from 7:00 am to 7:00 pm daily. The time reported in the table as Begin High Water is 7:00 AM.
- Glen Canyon Dam normal operations have lower water releases from 7:00 pm to 7:00 am daily. The time reported in the table as Begin Low Water is 7:00 PM.
- The “hours delay” is reported because dam water releases are frequently lower on Saturdays and even lower on Sundays. The day of the release should be taken into consideration.
- Reports vary on the “speed” that the tide travels, some report 4.0 mph and others report 5.0 mph. The first table uses time calculations based on 4.0 mph.
- In these days of low river levels (2007), the 4.0 mph rate may be more accurate. A separate table indicates times for this flow rate.
- The tide rate can also vary depending on the overall level of flow, “low” water travels slower than “high” water.
The bottom line on tides is that you can expect the water to drop out from under your boat in the night from Six Mile to North Canyon, and from Blacktail to Backeddy. Some folks don't worry about it, and just expect they will need to push their boats into the water in the morning if the river has dropped.
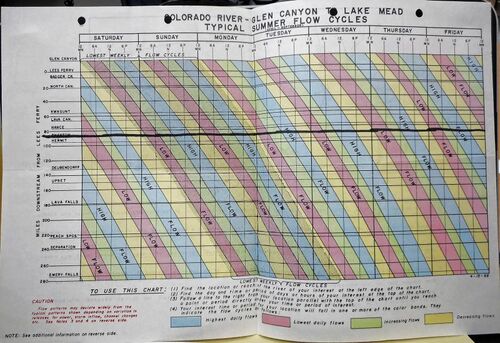
Here is a tide table from the late 1960's. You can download this public domain image at this link.
Click here to return to The Dam page.
Click here to return to The Place page.


